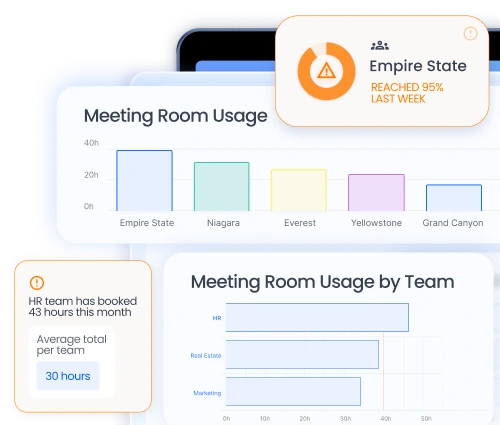
Tailor your meeting room offer to actual usage. Our dedicated dashboard enables you to analyze occupancy rates, booking habits and the most popular time slots.
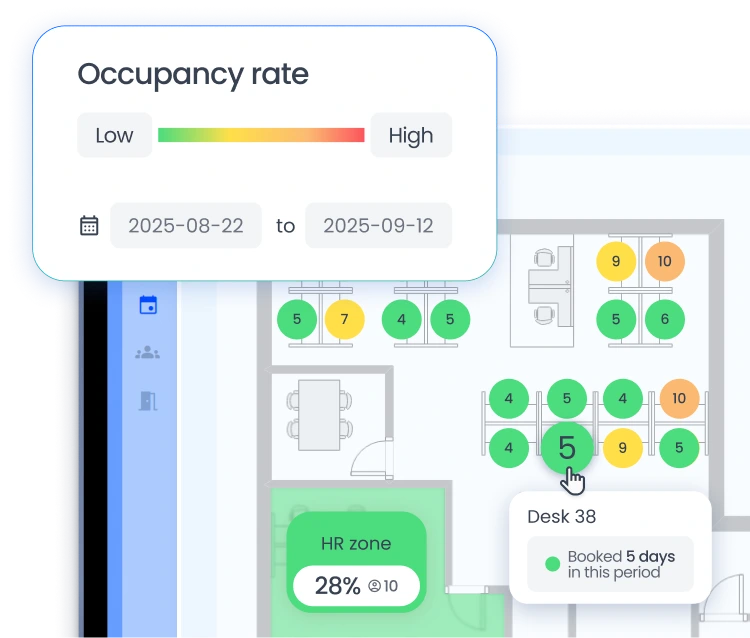
Understanding how your offices are actually used allows you to make factual decisions, without relying on impressions. With Deskare data, you can visualize occupancy, identify under-utilized spaces, and optimize layout according to your teams' actual needs.
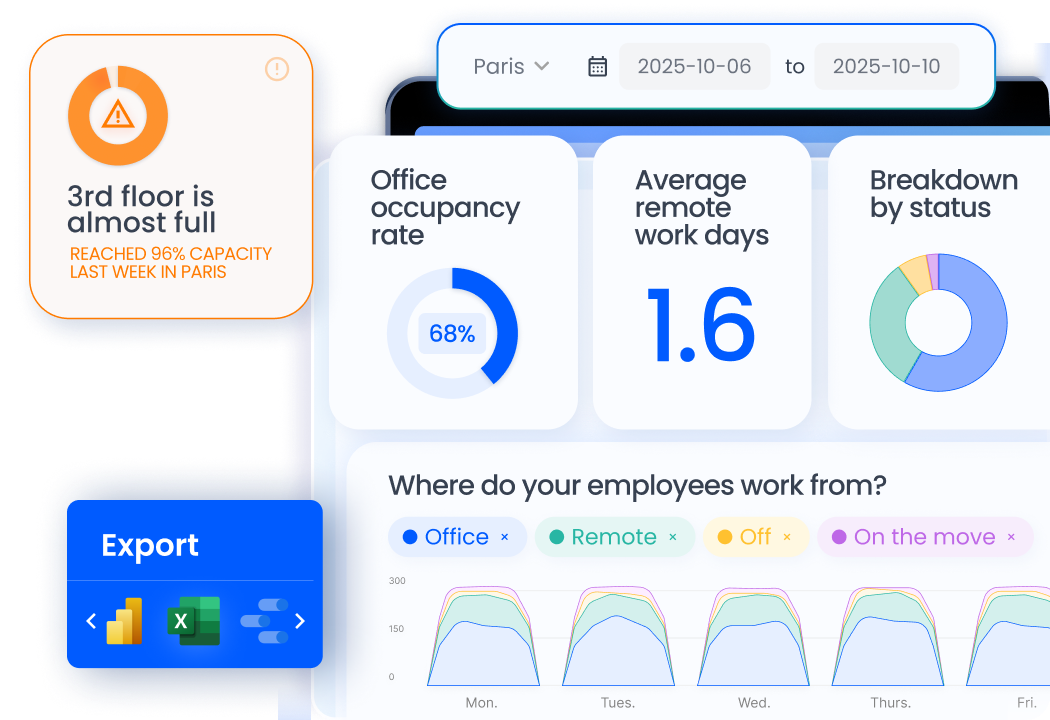
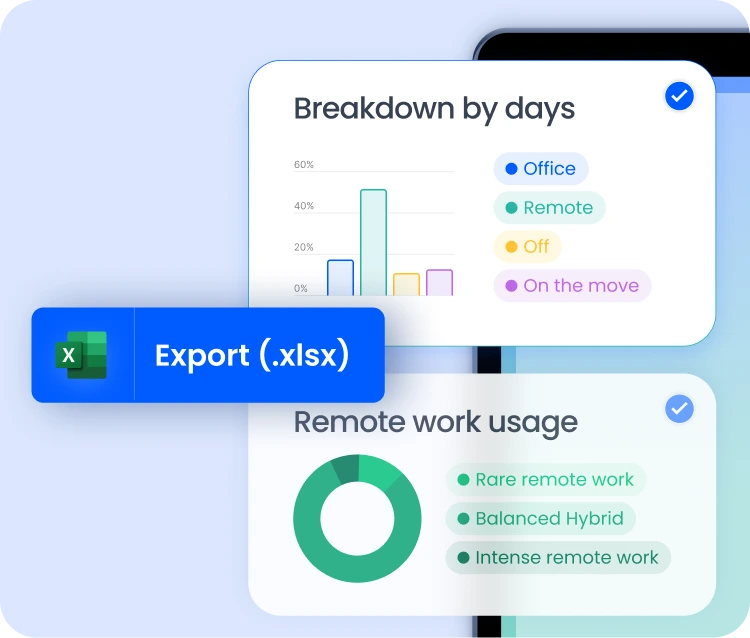
Yes, you can adapt the dashboards to your needs: choose the analysis period, filter by team, zone or space type... You can also easily export data in .csv or .xlsx format and integrate them into your existing tools like Power BI or Google Data Studio.
Thanks to the reliable data collected, you can reorganize your offices according to actual usage, adjust the number of workstations or parking spaces, and justify your decisions to managers, HR or the Works Council with concrete figures.
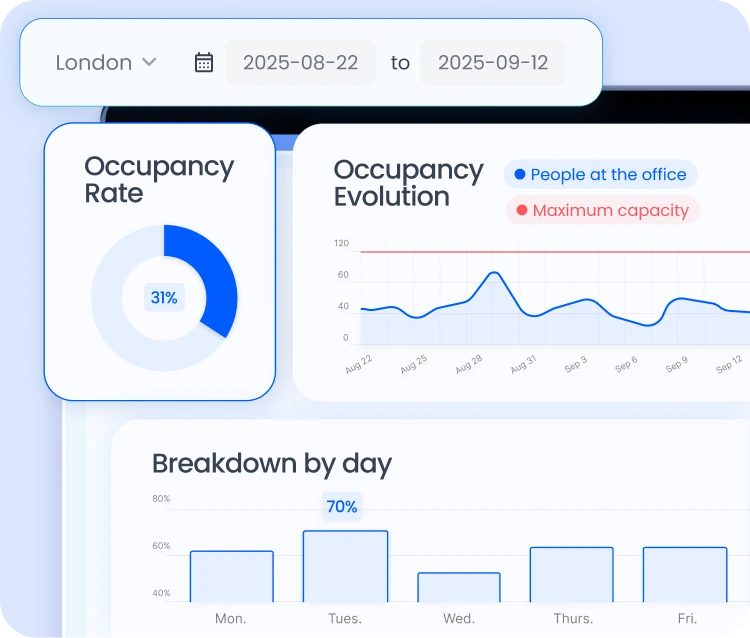
Deskare provides precise occupancy data: occupancy rate per day, average occupancy, over-occupied or neglected areas. These analyses, compiled in clear, easy-to-read dashboards, enable you to optimize your offices according to actual usage.
HR can monitor compliance with the remote work charter, detect cases of isolation and simplify the calculation of allowances. Managers have a precise view of their teams' work habits, and can more easily organize face-to-face meetings.
The key is employee adoption. Deskare offers automatic reminders and an intuitive interface to encourage declarations. On average, our customers achieve an adoption rate of over 95%, which guarantees the reliability of the analyses and decisions they make.


.webp)

.webp)
.webp)

.avif)
.avif)

.avif)


.avif)


.avif)
.avif)


.png)
.png)


